How to read AI detection results (for text, images, audio & video)?
When you upload text, images, audio, or video to isFake.ai, the system shows you not just a verdict but its level of confidence whether it’s AI or not. Convenient, right?
Let’s break it down a bit so you can easily read the detection results!
Text detection: how to read AI confidence scores?
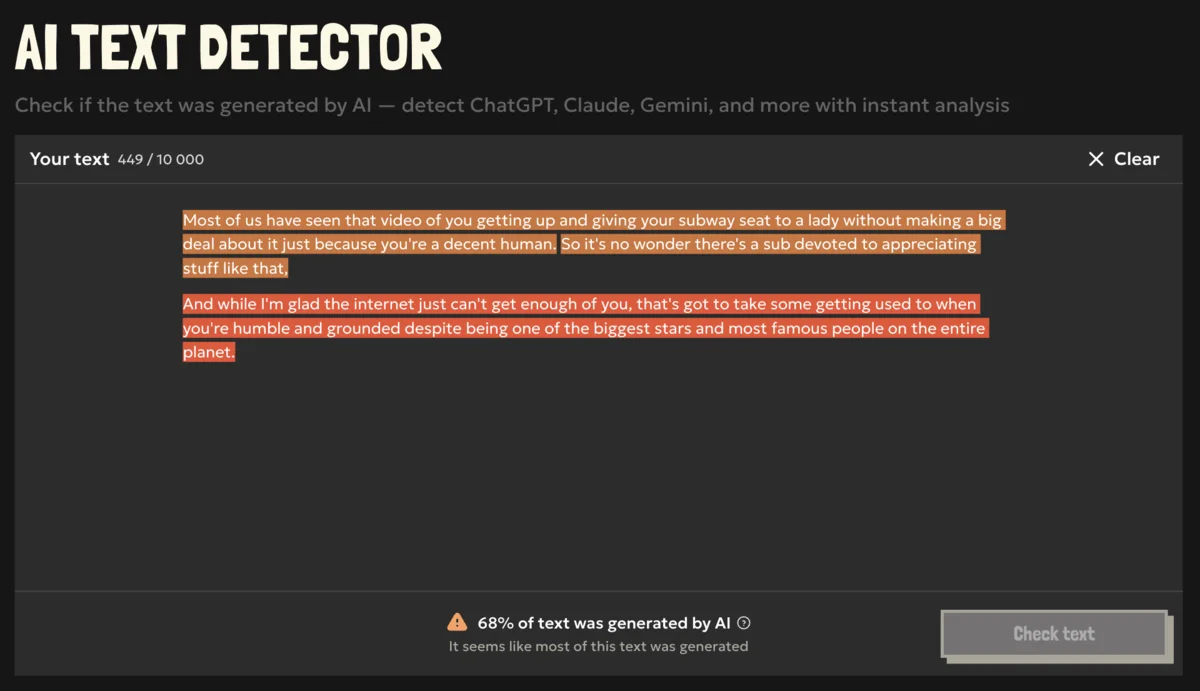
When you proceed with the text detection, the tool gives out the number.
This number is the confidence % that shows how strongly the model believes the text (or a fragment of it) looks AI-generated. The higher the number, the stronger the tool’s confidence the text was AI-generated.
But, wait, there’re also highlighted fragments…
Right, the tool also highlights those parts of the text that are the most questionable and suspicious. There’re 3 stages of ‘detection trust’:
- No highlights means that the text is very likely human.
- Yellow (30–60%) is unclear, could be AI-edited or mixed.
- Red (60–100%) is a strong signal of AI generation.
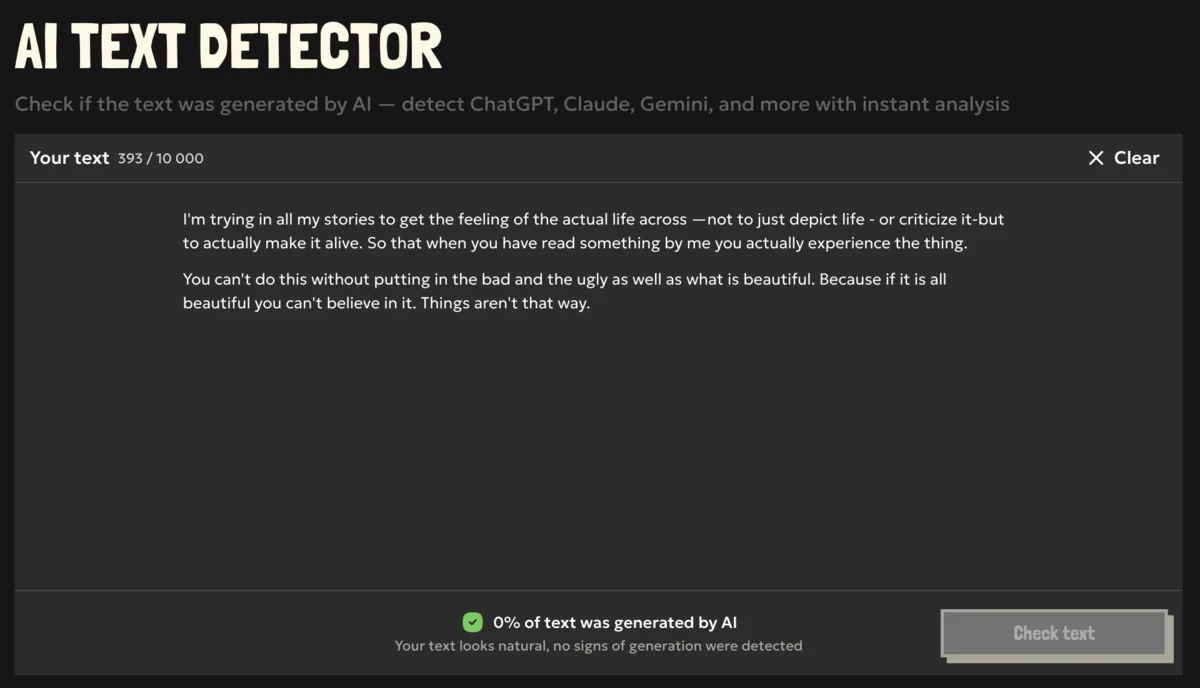
Can you guess which of these texts was written by Ernest Hemingway? We will give you 5 seconds.
Try it yourself in our AI text detector.
Image detection: heatmaps and confidence levels
For images the detection results are pretty similar. But the threshold is set at 50%.
And here we also use highlighting, but in the form of a heatmap.
- No highlights show that the model believes the image wasn’t generated by AI.
Most likely it’s real. - Red and yellow areas on the heatmap reveal the most suspicious fragments.
By the way, did you know that generative AI models work like real painters when creating images? They start from the bottom layer of their canvas and keep on putting layers on layers creating more details and fragments. That’s exactly why we use the heatmap.
Our tool can read through the layers and detect those areas in which the AI was used. Isn’t it cool?
The image model reaches ≈92% accuracy, so results here are reliable, but always read them in context.
Easily check images with our image detection tool.
Audio detection: spotting cloned voices
For audio, the system tries to catch the digital patterns that typically appear in AI-generated voices. Such include even inconsistent emotional tones and strange background sounds.
Thresholds for audio detection are:
- 0–30% — likely real.
- 30–60% — probably some part of the audio is AI.
- 60–100% — likely AI.
It’s impressive, right?
You can try it yourself in our audio detection tool.
Video detection: frame-by-frame deepfake analysis
Video is trickier, sometimes only parts of a clip are synthetic (like a swapped face or altered movement). But here we also use a system similar to heatmap. It breaks the video down into frames and every frame is being analyzed as an image, as well as all the transitions are being scanned and evaluated. And, ta-da, here we get the results!
Here, the model can also highlight some particular frames but not the whole video.
The approximate threshold for the video content looks the following way:
- 0–70% — green
- 70–90% — yellow
- 90–100% — red
Any concerns about video contents from the net?
Check it instantly with our AI video detection tool.
Why not just ‘AI’ or ‘Human’?
Because reality is rarely black and white.
- Any image can be real but heavily filtered and edited.
- A text may be human-written but include AI edits.
- An audio clip may be mostly authentic but contain AI-generated fragments.
That’s why we show probabilities, highlights, and explanations instead of a single binary label.
A false ‘AI’ labeling can harm creators, while missing synthetic content can spread misinformation. That’s why we tuned our thresholds to keep a healthy balance. In practice, this means you get results that are both trustworthy and fair, reducing risks on both sides.
To sum up
- Look at high-confidence red highlights first, they are the strongest AI signals.
- If you see a ‘yellow zone,’ treat it as possible AI editing rather than fully fake.
- Use the percentage of AI-flagged fragments to estimate how much of the content is synthetic.